
Call Toll Free +1 855-856-TIPS
AGGRECOST ASPHALT FUTURE RELATED CONTRACTS data tracks: Paving, Oil & Stone, Chip Sealing, Sealing, Modified Mix, WMA, HMA, Polymers & cold placed contracts.
Asphalt Season Kick-Off
Asphalt season is heating up quickly according to AGGRECOST’s data trackers. AGGRECOST has reported a increase 6 times of that from last week. This tracks new solicitations nationwide from private, municipal, agency and DOT sources. It does not include already pending contracts or ongoing and backlogged contracts in pipeline. Background story: WINTER CONDITIONS COOL CONSTRUCTION PROFITS AS ASPHALT STARTS TO HEAT UP
The season is taking off literally. The contract solicitation data tracks, Paving, Oil & Stone, Chip Sealing, Sealing, Modified Mix, HMA, WMA, Polymer and Warm/Cold placed contacts.
Asphalt is one of the few sectors that did not miss a beat last fiscal year despite the pandemic. Road & Highways continued to get completed as work went mostly unchanged.
It is not unusual to see the spring spike in solicitations. What is alarming is that production and output was on a upward pattern last fiscal year. In addition construction and installation of such asphalt related materials did not decrease in 2020.
We are seeing a knee jerk reaction from local governments that point to increased contracting this year in anticipation of the Infrastructure bill. This includes possible preparing to spend or have spent such funds in anticipation of Federal Infrastructure Bill budget calculating methods.
See also background: American Jobs Plan: President Biden Presents His $2T Infrastructure Plan , President Biden Holds First Press Conference, Will Unveil $3T Infrastructure Plan Next Week
State of Asphalt Prices: The Risks, Indicators & Trending Price Forecast
Bylt performed end of year 2020 spot pricing survey at local asphalt plants at 2020 and spring open of 2021. We are seeing most increases between 8-12% increase per ton FOB PICKUP as of April 2021 from end of season 2020 on HMA mixes for road construction.
RISKS THAT CONTINUE TO AFFECT ASPHALT & CONSTRUCTION
- Geo-Political price compounding
- Escalation & Inflation
- Oil & Gas Transportation Costs
- Aggregate & Sand Production, Hauling Cost Increases
- Production Capabilities & Corona effect
- Chip Shortage that is effecting newer construction equipment including GPS, Paving Machines, Rollers and Hauling Vehicles
- Labor Shortages
- Oil related production and Imports
U.S. asphalt manufacturing selected figures 2019 & 2020
The asphalt manufacturing industry in the United States generated revenues amounting to around 26 billion U.S. dollars, with 1,591 businesses across the country as of August 2020. This industry experimented an annual growth of some 0.7 percent in the period comprised between 2014 and 2019 as well as between 2015 and 2020.
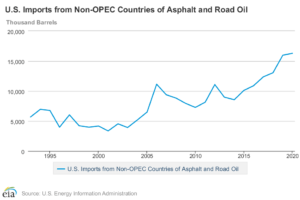
U.S. Imports from Non-OPEC Countries of Asphalt and Road Oil (Thousand Barrels) |
Decade |
Year-0 |
Year-1 |
Year-2 |
Year-3 |
Year-4 |
Year-5 |
Year-6 |
Year-7 |
Year-8 |
Year-9 |
|---|---|---|---|---|---|---|---|---|---|---|
1990’s |
5,644 |
6,923 |
6,728 |
3,947 |
5,993 |
4,215 |
3,963 |
|||
2000’s |
4,136 |
3,312 |
4,547 |
3,890 |
5,120 |
6,491 |
11,141 |
9,355 |
8,790 |
7,943 |
2010’s |
7,262 |
8,117 |
11,050 |
8,952 |
8,532 |
10,073 |
10,838 |
12,380 |
13,022 |
15,969 |
2020’s |
16,264 |
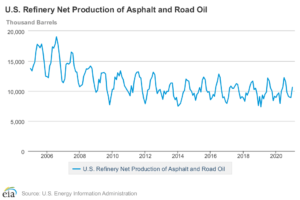
U.S. Refinery Net Production of Asphalt and Road Oil (Thousand Barrels) |
Year |
Jan |
Feb |
Mar |
Apr |
May |
Jun |
Jul |
Aug |
Sep |
Oct |
Nov |
Dec |
|---|---|---|---|---|---|---|---|---|---|---|---|---|
2005 |
13,754 |
13,349 |
14,165 |
14,818 |
16,694 |
17,795 |
17,500 |
17,180 |
17,833 |
16,670 |
14,504 |
12,474 |
2006 |
12,408 |
12,213 |
14,168 |
14,657 |
17,350 |
17,163 |
17,845 |
19,025 |
17,787 |
16,240 |
14,217 |
11,638 |
2007 |
11,386 |
12,002 |
14,445 |
14,648 |
14,464 |
14,708 |
16,466 |
16,277 |
14,164 |
13,255 |
13,147 |
11,308 |
2008 |
10,713 |
10,894 |
11,094 |
12,474 |
13,057 |
13,688 |
13,656 |
13,866 |
14,184 |
13,758 |
12,067 |
10,559 |
2009 |
9,805 |
10,158 |
11,955 |
11,366 |
12,955 |
13,009 |
13,066 |
12,823 |
10,167 |
9,050 |
7,710 |
8,907 |
2010 |
10,277 |
10,314 |
12,287 |
11,886 |
13,038 |
12,500 |
13,326 |
12,298 |
11,916 |
10,861 |
10,431 |
10,068 |
2011 |
9,661 |
9,200 |
10,886 |
9,752 |
11,566 |
12,785 |
13,138 |
13,200 |
12,328 |
12,163 |
9,873 |
8,758 |
2012 |
7,882 |
8,769 |
10,152 |
10,351 |
11,826 |
12,298 |
13,106 |
12,699 |
10,664 |
9,567 |
10,066 |
10,269 |
2013 |
9,321 |
8,596 |
9,973 |
9,494 |
9,914 |
9,923 |
10,961 |
11,314 |
11,301 |
9,119 |
8,541 |
8,894 |
2014 |
7,475 |
7,685 |
7,922 |
8,831 |
9,805 |
10,072 |
11,990 |
11,753 |
11,645 |
10,246 |
9,957 |
9,281 |
2015 |
9,622 |
8,430 |
9,436 |
9,676 |
10,533 |
9,841 |
11,854 |
12,303 |
11,909 |
10,122 |
9,768 |
9,874 |
2016 |
8,563 |
8,831 |
9,426 |
9,135 |
10,791 |
11,534 |
12,804 |
12,274 |
10,113 |
8,854 |
9,011 |
8,174 |
2017 |
7,942 |
8,888 |
10,521 |
10,795 |
10,441 |
10,429 |
10,799 |
11,249 |
11,052 |
9,667 |
8,735 |
9,084 |
2018 |
8,873 |
8,276 |
9,687 |
9,334 |
9,977 |
10,867 |
11,434 |
11,654 |
10,240 |
10,442 |
9,638 |
7,541 |
2019 |
9,038 |
7,336 |
9,326 |
8,693 |
9,400 |
9,808 |
12,142 |
11,680 |
10,492 |
9,980 |
8,384 |
9,085 |
2020 |
8,920 |
9,345 |
9,692 |
7,902 |
9,946 |
10,596 |
12,228 |
11,509 |
9,769 |
9,130 |
8,960 |
8,928 |
2021 |
10,587 |
|||||||||||
Related News
Stockpiles are minimal on raw products and only RAP stored millings has a extensive national stockpile.
Forecasting The Potential Further Increases In Asphalt Related Construction Work Price Increases From Geo-political Climate & Other risks
AGGREGATE QUARRIES & ASPHALT PLANTS
$27.0 billion in construction aggregates production (construction sand and gravel and crushed stone). Crushed stone was the leading non fuel mineral commodity in 2020 with a production value of $17.8 billion and accounted for 22% of the total value of U.S. non fuel mineral production.
The U.S.A is the worlds largest producer of sand and gravel producing 960 Million metric tons. The national average price per ton of sand and gravel was $9.59 per metric ton in 2020. This was an increase from $9.32 MT in 2019
EXPECTED FURTHER IMPACT
Quarries and aggregate producing facilities along with their sibling, Asphalt Plants, will no doubt see the regulations tighten further as months deepen into the Biden administration and Trump subsides.
Already quarries are seeing necessary production levels increase and are struggling to keep up through the end of the year. Consumption increases like from the Natural gas industries such as fracking have been consuming huge amounts of sands for processing that are unrelated to infrastructure improvements.
Quarry and Plant expansion or development are now being faced with extreme scrutiny as we are seeing across the country as what is trending to what we see as a push towards further climate and environmental beneficial products and practices. RHODE ISLAND GOVERNOR GINA RAIMONDO TO INTRODUCE THE GLOBAL WOMEN IN TECH GLOBAL MENTORSHIP
Political climate articles on Asphalt Plants:
1) Town of Niagara Board rescinds approval of asphalt plant
2) Louisa family says they had no idea their new neighbor would be an asphalt plant
3) Applicant Behind Controversial Asphalt Plant No-Show At Meeting
4) Angier residents raise concerns about asphalt plant proposal
General Contractors should expect to see these issues create Geo-political cost compounding through out the year and in turn increase asphalt production and materials costs steadily, most likely even being taxed in a effort to stimulate alternative practices and products in the upcoming infrastructure bill and fourth coming new tax legislation.
Conclusion
Regulation and Geo-political climate will be the main risk and cost increase origin. Supply will most likely not be able to meet demand output in coming months. Most US asphalt plants have hourly and daily manufacturing limits set fourth, regulating the amount a particular asphalt plant can make. Certain geographic locations will have extensive backlogs this year and or possibly require emergency government intervention for tonnage output deregulation. We will see a steady cost increase along with supply and demand issues throughout 2021 and beyond. Logistics and supply chain will also see a compound increase resulting from the transportation fuels costs along new oil production outlooks and decisions.
We unfortunately conclude and expect cost increases to peak in 2022 or beyond and to subdue when costs of fossil type admixes and materials reach a equal to or more expensive in comparison rate of the climate and environmental competing products that exist such as Polymers from Natural Gas Production (sustainable) and Bio-Polymers (renewables: sugar polymers or bio-char and bio-bitumen process derived)
Further and increased production, research and development of greener surfacing will be put on the front burner as well as new emerging industries like AERO-AGGREGATES .
In place Asphalt is the leading problem and contributor to heat island effect. It’s manufacturing processes and development methods are also highly regulated and most locations have restrictions on further new locations and expansion. Moves to polymer transparent mixes and mixology will becoming more cost effective in the years to come and become more available. Polymers mixes cure transparent and cure to whatever the aggregate color and grain are. Ideal in demand aggregates for the polymer pavement manufacturing process are limited to granites but only require warm water mix to manufacture.
Source
AGGRECOST